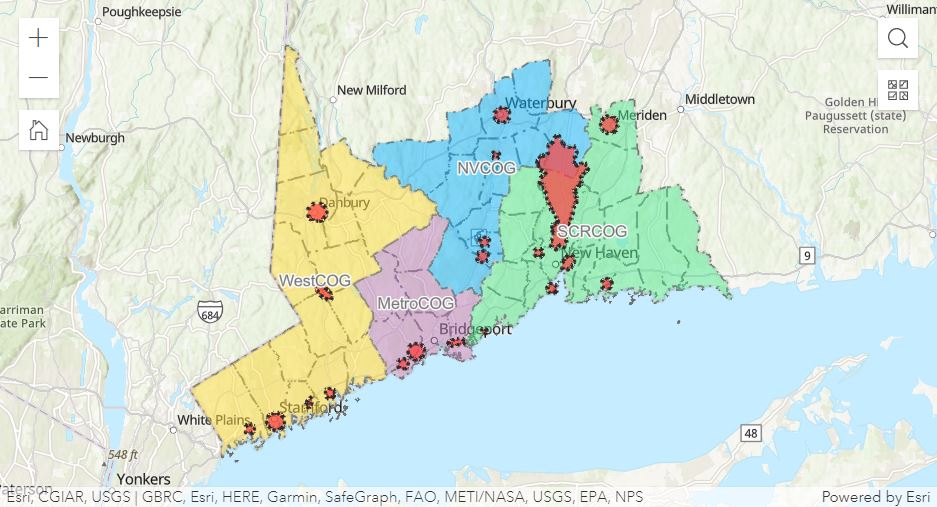
Story maps help explain the project through more dynamic images, maps, and text. Start by viewing the "Resilient Connecticut" story map to learn more generally about the project - it explains terms like vulnerability, zones of shared risk, and describes previous state planning efforts along with a new climate change vulnerability mapping tool for flood and heat. To learn more specifically about the top 20 Resilience Opportunity Areas (ROARs) identified in New Haven and Fairfield Counties, click on a story map for each of the 4 Council of Governments (COG) in the region. These "ROARs" were chosen based on vulnerability assessments as well as ongoing engagement with stakeholders to incorporate municipal and regional goals.
Climate Change Vulnerability Index
Demo the latest climate vulnerability mapping tool for flood, heat and wind stressors. The Climate Change Vulnerability Index (CCVI) is a regional tool developed for New Haven and Fairfield Counties that can be used, in conjunction with other resources, for planning and developing purposes. Additional CCVI resources include fact sheets, previous workshop materials, and links to reports describing Connecticut's climate projections for precipitation, heat, and sea level rise to 2050 and beyond.

Social Vulnerability
The social vulnerability (SV) mapping created for Resilience Connecticut has been developed as a hybrid approach based on two commonly referenced methodologies. The vulnerability factors used in the mapping are those used in the University of South Carolina Social Vulnerability Index (SoVI). However, the Resilient Connecticut analysis provides finer scale values as it utilizes block group census data in comparison to SoVI which uses tract data. To calculate the social vulnerability, and develop a more repeatable process, the Center for Disease Control and Prevention (CDC) Social Vulnerability Index (SVI) mathematical methodology was used. This hybrid SV mapping utilizes a variety of social factors that are indicative of social vulnerability while using a straightforward mathematical depiction of percentile ranks to characterize social vulnerabilities in New Haven and Fairfield counties using statewide values.
Connecticut Coastal Towns Storm Annual Exceedance Probability/Return Interval
The highest 44 storms between 1950-2018 were reproduced using a coupled circulation and wave model to show the annual exceedance probability (or return period) of storm surge water levels and significant wave height for each of Connecticut's 24 coastal towns. The results presented in a tool, data, and journal article highlight the storm surge water levels and significant wave heights, which may contribute to a better understanding of extreme storms and guide decision-makers.
Coastal Vulnerability Index
This map viewer is a GIS based tool to express a one-dimensional, interactive risk index at multiple scales. The influence of different factors to the effects of sea level rise are incorporated to help users visualize the relationship between environmental, socio-economic, and built contributors in terms of exposure, sensitivity, and adaptive capacity at a range of locations. The tool indicates a high to low rank for coastal vulnerability from the impacts of sea level rise.


Connecticut Sea Level Rise and Storm Surge Viewer
This dataset shows different flood maps with return periods and sea-level rise projections above a Mean Higher High Water (MHHW) along the Connecticut coastline and the adjacent inland. CIRCA research recommends that planning anticipates sea level will be 20 inches higher than the national tidal datum in Long Island Sound by 2050. CIRCA’s report on Connecticut sea level rise provided the basis for projections in Bill S.B. 7, which was introduced into the 2018 legislative session and was enacted into law as Public Act 18-82.
CREST Viewer
Five points distributed along the shoreline of Connecticut were chosen as locations for reporting results from the wave modeling work funded by a two-year grant from the National Oceanic and Atmospheric Administration (NOAA) to the University of Connecticut. There is a page for each point, 8797, 12470, 15631, 16339, 18277, as well as some information in the map when the point is clicked. The blue squares are two NOAA buoys. The viewer legend explanation can be found here.
Connecticut Coastal Towns Storm Annual Exceedance Probability/Return Interval Viewer
This dataset shows the annual exceedance probability (or return period) of storm surge water levels and significant wave height for each of Connecticut's 24 coastal towns obtained from coupled circulation-wave model (a recent Journal of Marine Science and Engineering article outlines this modeling approach). Results highlight storm surge water levels and significant wave heights, which may contribute to a better understanding of extreme storms and guide decision-makers.
Connecticut Coastal Vulnerability Index Viewer
This map viewer shows the influence of different factors at a range of locations to the effects of sea level rise. The GIS mapping helps visualize the relationship between environmental, socio-economic, and built contributors in terms of exposure, sensitivity, and adaptive capacity. A high to low ranking of coastal area vulnerability to sea level rise is indicated.